Wakely Risk Insight National Reporting Project (WRINR)
What drives profitability in ACA markets? Let WRINR show you.
The Wakely Risk Insight National Reporting (WRINR) Project is the largest ACA member-level profitability study of its kind; Wakely has been performing the study for over a decade. We analyze data from more than ten million individual and small-group ACA lives with our innovative Wakely Risk Insight (WRI) software. Using the results, participating issuers can identify key profitability drivers, and see how their own drivers compare to national benchmarks.
Participation in the WRINR project is offered as a free service to issuers, providing invaluable insights into the ACA market.
Results you can use, in two formats.
Wakely’s WRINR analysis is provided to participating issuers in two formats:
- Written report in PDF format
- Power BI – A web-based visual platform that helps users understand issuer-specific and national trends
Request a consultation to learn more about WRINR.
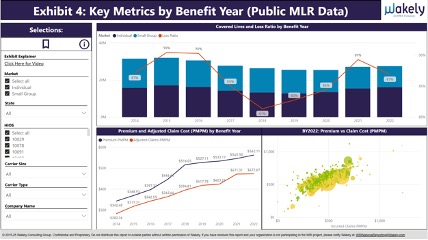
Sample Power BI Exhibits:
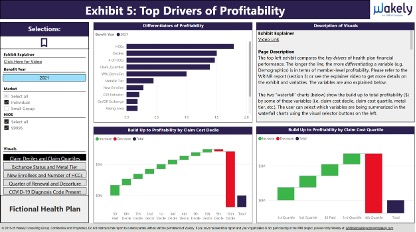
Thorough analysis to find key drivers of profitability.
To find drivers of profitability, the WRI algorithm examines study data by:
- Demographics
- Metallic tiers
- Hierarchical Condition Categories (HCCs)
- Rating area
- Deciles and quartiles of cost
- and more
Reporting also includes regional benchmarks, such as:
- High level utilization and unit cost by service categories
- Impact of supplemental diagnosis codes (from chart reviews) for your organization vs. sampled average
- Utilization of specialty/high-cost drugs for your organization vs. sampled average
- Prevalence and net income by each individual HCC for your organization vs. sampled average